Characterizing Microservice Dependency and Performance: Alibaba Trace Analysis
作者信息:UM CDS Lab
链接:
摘要:Loosely-coupled and light-weight microservices running in containers are replacing monolithic applications gradually. Understanding the characteristics of microservices is critical to make good use of microservice architectures. However, there is no comprehensive study about microservice and its related systems in production environments so far. In this paper, we present a solid analysis of large-scale deployments of microservices at Alibaba clusters. Our study focuses on the characterization of microservice dependency as well as its runtime performance【依赖性和性能】. We conduct an in-depth anatomy of microservice call graphs to quantify the difference between them and traditional DAGs of data-parallel jobs【微服务和DAG的区别】. In particular, we observe that microservice call graphs are heavy-tail distributed and their topology is similar to a tree and moreover, many microservices are hot-spots. We reveal three types of meaningful call dependency【三种依赖性】 that can be utilized to optimize microservice designs. Our investigation on microservice runtime performance indicates most microservices are much more sensitive to CPU interference than memory interference【对CPU资源更敏感】. To synthesize more representative microservice traces, we build a mathematical model to simulate call graphs【数学模型模拟】. Experimental results demonstrate our model can well preserve those graph properties observed from Alibaba traces.
Introduction:
- 微服务
- 先前benchmarks的缺点:生产环境小
- 本论文要做什么
- 微服务调用图
- heavy tail分布
- 类似树
- hot spots
- 高度动态的依赖性
- 基于微服务依赖性的优化可能
- 可将部分没有其他分支的耦合在一起
- 可将某些上游微服务和多次调用另一微服务的耦合在一起
- 微服务对CPU干扰比内存干扰更敏感
- 随机模型可以很好模拟动态的微服务调用图
- 微服务调用图
Background:
2.1 微服务架构:
- 调用图
- 上下流概念
- 无服务/有服务
- 三种通信范式
- 分层依赖性和响应时间
2.2 trace overview:检测系统【这里要再看看】
- 物理运行环境
- 微服务系统指标
- 微服务调用图中的调用
- 总计的调用数据:每个节点单独计算
Anatomy of call graphs
3.1 和DAG图的区别
量化表示微服务的数量、调用的深度和微服务的分布
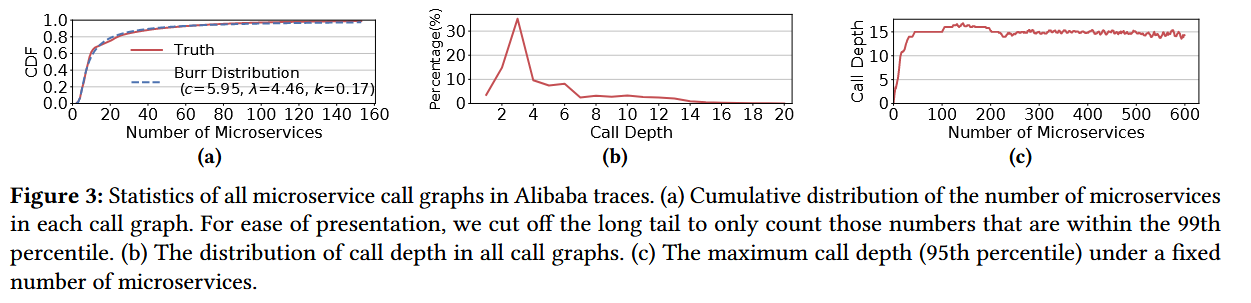
a:微服务调用图的CDF图。
- 10%调用图包含了超过40的unique 微服务,最大的调用图甚至包含成百上千个微服务。
- 对于大的图,其微服务超过50%都是Memcacheds备忘录,是小图的120%。所以针对Memcacheds可能能做点优化。
b:微服务调度图的深度。
- 数量最多是3,平均值4.27,标准差为3.25:实际情况一般比关键路径要短。
- 超过4%调用图深度长于10:传统机器学习方法可能会出现过拟合。
c:调用深度的 P95 最大call depth,阻塞在15左右,说明并不是链式的,可能是树类型。
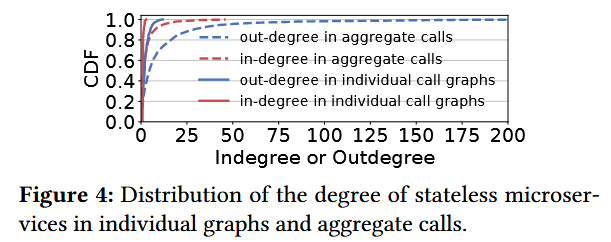
图4:
- 大部分微服务in-degree为1,超过10% out-degree大于5
- 超过5% in-degree超过16:热点函数
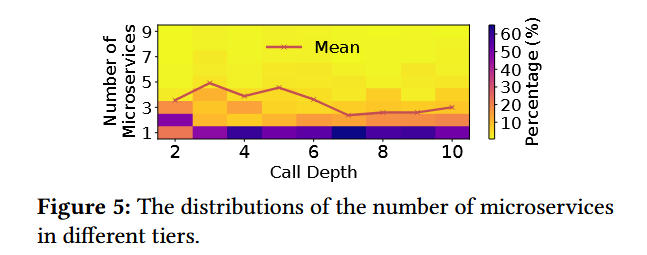
图5:当深度大于2时,下一个节点只有一个的概率增加
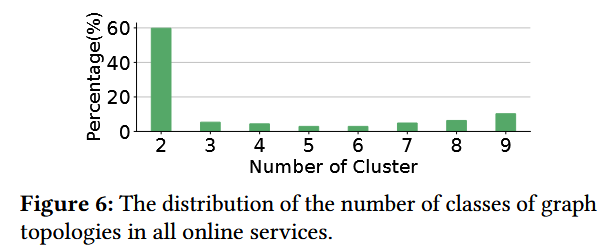
图6:拓扑的动态性,所有微服务拓扑至少超过2个动态拓扑。
3.2 图形学习算法 Graph learning algorithms
3.3 刨析